Rhode Island Employment Snapshot, August 2014: What Goes Up Comes Down
Whether or not one believed the six-month boom in employment that government statistics proclaimed, the trend has turned around in Rhode Island. The unemployment rate may have frozen at 7.7%, which is definitely an improvement over our nearly six years above 8%, but much of the credit goes to the large reduction in the labor force.
Even if fewer people are working, the unemployment rate goes down if an even larger number of people decide not to look for work.
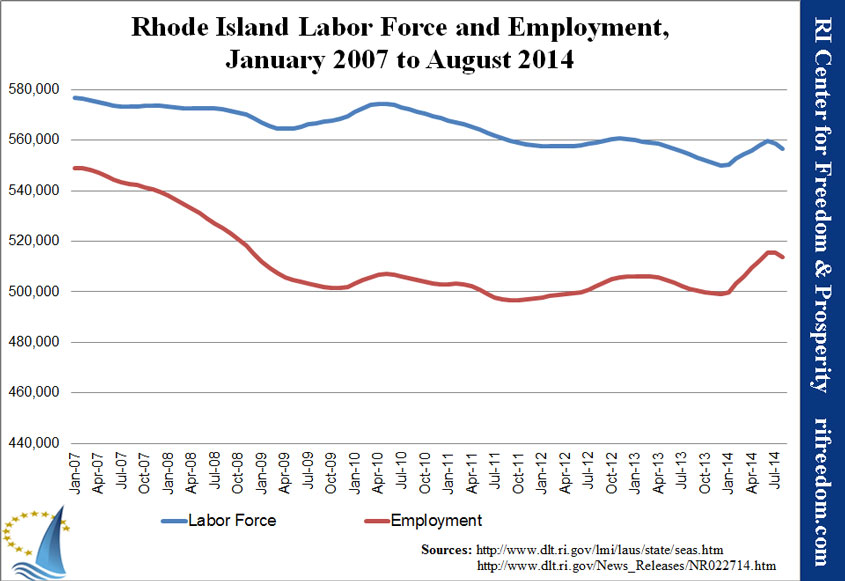
The first chart below shows the dramatic rise of the first six months of the year (which a January revision will likely flatten out) followed by the reversal. The recent shift of the lines is a good illustration of how the rate works. If the upper line, which is labor force, had increased more than the lower line, which is employment, the unemployment rate would have gone up. That circumstance can actually be an indication of a rebounding job market, because it shows that people are sufficiently optimistic to start looking for work again.
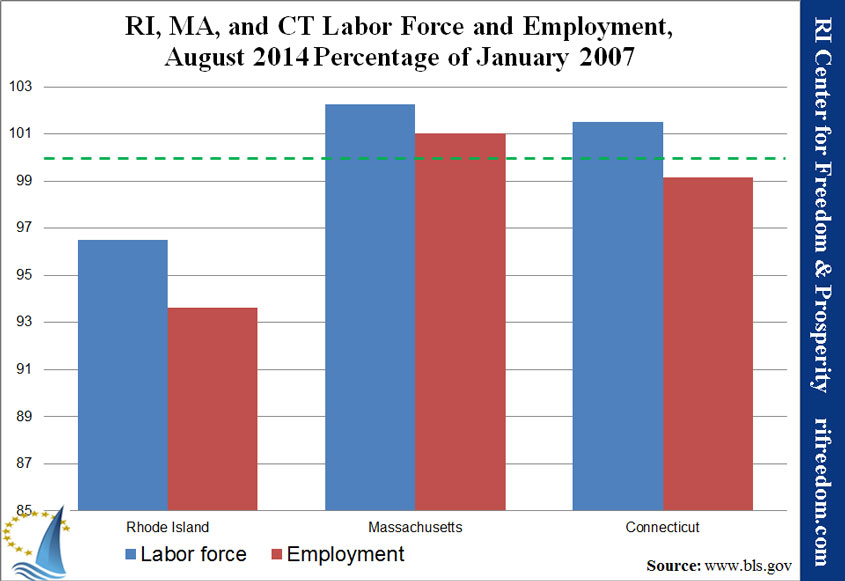
The second chart shows how Rhode Island, Massachusetts, and Connecticut are faring versus their labor forces and employment before the recession. Clearly, the Ocean State has a long way to go.
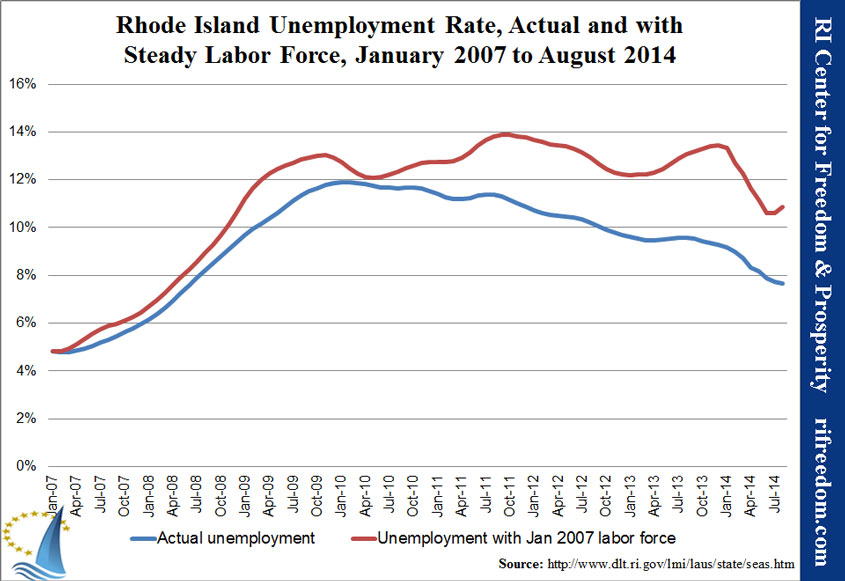
The third chart shows what the unemployment rate would have been if the labor force had remained the same throughout the recession. The big takeaway is that the unemployment rate would have peaked much higher, but the newer takeaway is the uptick of the red line over the past few months. What it illustrates is that the unemployment rate would be going back up, rather than freezing or edging down, if more people weren’t giving up on looking for work.

Leave a Reply
Want to join the discussion?Feel free to contribute!