Employment Consequences of Kid-Brother Economics
Commentary: Rhode Island’s Follower Plan
Throughout the Great Recession, Rhode Island’s leadership has had the air of helpless wisdom about the predicament of their state’s economy.
“We’re traditionally first into a recession and last out,” Governor Lincoln Chafee (Ind.) told David Klepper of the Associated Press, in December 2011. A few weeks later, RI House Speaker Gordon Fox, arguably the most powerful politician in the state, told WPRI’s Newsmaker interviewers the same thing, almost verbatim.
Nobody in office would say so directly, but general acceptance of that trend has been evident in the priorities and areas of inaction in both the executive and the legislative branches. And when the economic plan is simply to wait for a national recovery to pull the state forward — call it “kid-brother economics” — all that remains is to gloss over the numbers in the meantime.
The Policy Brief
Click here for a PDF of the Policy Brief of RI’s employment trends or read below
See the Media Release at the bottom of this post
The Ocean State’s Unique Status
Rhode Island is suffering through an employment crisis and a jobs outlook more severe than any other state in the country. Residents, hoping to assume more control over their families’ future through some sense of job and wage security, unfortunately, face deteriorating prospects.
No other state in the nation ranks as poorly as Rhode Island in employment when viewed across so many angles. Among all U.S. states:
- RI has the second highest unemployment rate in the nation and is one of only three states with unemployment above 10% (NV, RI, and CA). Of them, only RI has a smaller total labor force as compared with prerecession levels.
- RI’s unemployment rate would be significantly higher if workers hadn’t given up hope. With its February 2010 labor force, RI’s rate would now be 13.4%; with its January 2007 labor force, it would be 14.2%. Applying the same calculations nationwide, the bottom three would be RI, NV, and AZ in the first case and MI, RI, and IN in the second.
- RI is one of only two states significantly below the national norm in measuring current employment versus prerecession peak employment (MI and RI). Of these two, only RI’s trend continues to worsen.
- RI is one of only three states that have continued to shed employment since the national employment loss trend ended in February 2010 (RI, AZ, and NY).
When viewed from each of these perspectives, Rhode Island ranks in the bottom two in all four categories. No other state appears more than twice.
Unemployment Is Relative
When it announced the state’s employment results for July, the RI Dept. of Labor and Training (DLT) emphasized the fact that the unemployment rate has been on a slow downward trend. The state’s…
… seasonally adjusted unemployment rate for July 2012 dropped to 10.8 percent, down one-tenth of a percentage point from the June 2012 rate and six-tenths of a percentage point from the previous July. This is the third consecutive monthly decrease in the unemployment rate, and represents the lowest unemployment rate in Rhode Island since May 2009.
While Rhode Islanders are surely in the mood for whatever good news they can get, this may not fill even that modest requirement. That 10.8% does look better than June’s 10.9% and May’s 11.0%, but it still leaves Rhode Island as the runner-up in high unemployment rates, second only to Nevada.
Worse, RI is now one of only three states with unemployment above ten percent, and the others have been exhibiting better trends overall (see Chart 1). Both California and Nevada passed the Ocean State in early 2009, but as 2013 approaches, they’re on pace to drift below, as CA already has.

The federal Bureau of Labor Statistics (BLS) which compiles employment data for the nation and the states also tracks alternate measures of unemployment. In these cases, the trends are tracked quarterly (every three months), and the number represents the average over four quarters.
The BLS collects its data through a regular Current Population Survey (CPS), which asks respondents a number of questions related to their employment situations. All of the rates shown are percentages of different totals for the “civilian labor force.”
The most common (as represented in Chart 1) is the U-3 measure, which tracks people who are not working, but who want to do so and have looked for jobs within the past four weeks. The denominator for this rate (i.e., the labor force, or 100%) is the total number of people who say they are either employed or looking for work.
Chart 2 shows trends for the U-1 unemployment rate, which traces the number of people who have been unemployed for fifteen weeks or more.
, Rolling Four-Quarter Average, 4Q03-2Q12")
Broadening the length of time that residents have been unemployed is one way to adjust the data. Broadening the definition of “unemployed” is another. The BLS digs deeper with survey respondents who are not looking for work by asking when they last did so and why they stopped.
Those who have looked for work within the past year, but stopped no less than four weeks before the survey because they had given up hope of ever finding jobs, are “discouraged.” Broader still is the category for “marginally attached workers,” who followed the same pattern as discouraged workers, but without regard to their reasons for stopping their searches (U-5).
Unemployment trends by this measure are shown in Chart 3. The denominator for the percentage is the labor force defined above plus all marginally attached workers. In this case, Rhode Island still — just barely — has the third worst rate.

The broadest measure of unemployment that the BLS tracks is the U-6, which adds people who are working part time because they cannot find full-time jobs. Comparing Chart 4 with the first three suggests that, when Rhode Islanders find work, it is more likely to be full-time work, in comparison with California and Nevada.

Still, with a current rate of 18.9%, that silver lining does not offer much comfort, especially considering that RI’s stagnation remains incontrast with improvement in the other two states.
An Even Gloomier Picture
Unfortunately, even the dispiriting picture of the unemployment rate is overly sunny for Rhode Island. The multiple parts of the unemployment rate equation actually disguise just how badly the recession has hit in the Ocean State. Chart 5 shows what Rhode Island’s unemployment rate would be if its labor force had remained the size it was in January 2007 (at the start of the recession) and in February 2010 (when employment losses receded at the national level).

An analysis of total labor force statistics — the actual number of residents working or looking for work — shows that both California and Nevada have seen substantial increases since January 2007, while Rhode Island has seen a substantial decrease. In fact, under the January 2007 labor force scenario shown in Chart 5, both California and Nevada would have unemployment rates below 8%.
In both of those other states with official unemployment currently over 10%, more people wanted to work than before the recession, driving up the unemployment rate. Indeed, the big jump that Nevada experienced in July 2012 (refer back to Chart 1) was amplified by the fact that nearly 2,000 more people were looking for work.
In contrast, so many people stopped looking for work in RI that the unemployment rate could have stayed low even if the economy didn’t create a single job. Employment fell so rapidly that people couldn’t quit the job market fast enough to com-pensate. The two western states had the much more positive task of creating new jobs for new workers.
An Employment Spiral
The fact that the unemployment rate can be misleading, in this way, raises the question of what other measures might give a more accurate picture of the state’s employment trends. One excellent indicator is the number of people employed.
The same BLS survey estimates the number of residents of each state who say that they are working. Chart 6 shows the July 2012 employment number in all fifty states as a percentage of each state’s peak before the housing bust and financial crisis turned its employment growth negative.

Eight states have already surpassed their peaks, and most of the rest are within five percentage points, including California and Nevada. At the bottom of the chart are two outliers that are still around ten percentage points away from their prior level of employment: Michigan and Rhode Island.
Another important question is whether a state’s employment picture is improving. RI’s is not.
Just as Rhode Island has the second worst unemployment rate, it also has the second worst deficit from its peak employment. And just as Nevada is gaining ground on Rhode Island by the first measure, Michigan is gaining ground by the second. That realization, in turn, leads to a final observation of the Ocean State’s condition.
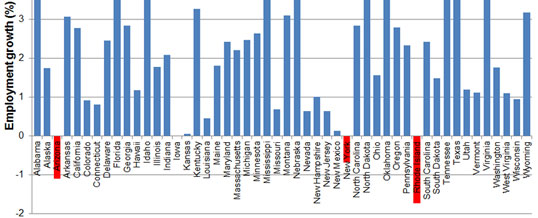
Two years of disappearing jobs in the United States came to an end in February 2010, after which both the number of jobs available and the number of people working began to increase (albeit, slowly and unsteadily). Since then, only three states have continued to shed employment. As Chart 7 shows, not only is Rhode Island once again on that short, undesirable list, but it is dead last… by quite a bit.

One Discrepancy
Given the negative trends apparent in this data, it’s important to explain that the employment/unemployment measure is different from the jobs numbers that Governor Lincoln Chafee recently authorized the DLT to release. This brief addresses the number of Rhode Islanders who say that they are employed; the DLT data is based on surveys and tax information from employers regarding the number of employees that they have.
In the latter case, local analysts dispute the BLS’s employer-based statistics, which find a decrease in jobs over the past year. The RI DLT claims an increase of 4,800 jobs from March 2011 to March 2012, while the U.S. BLS claims a decrease of 2,200 over that period.
One potential explanation for at least some of that discrepancy has to do with seasonality. The BLS updates its official employer-based jobs count annually, benchmarking to tax forms. Small-scale surveys suffice for real-time trends.
The RI DLT has broken with this methodology mainly by reviewing unemployment insurance tax data as it becomes available and assuming that the prior year’s seasonal adjustments still apply. Those numbers may require a significant adjustment when the final data is collected if any months were notably different than the same month in the past.
Whichever employer-based jobs number is correct, the data in these seven charts need not be affected. If, for example, people who were already working took additional jobs, the official job growth would have less effect on employment.
Probably more significant is the possibility that Rhode Island employers hired people who do not live in the Ocean State, or that people working in Rhode Island emigrated across the border. In those cases, the number of jobs could go up even as the state’s employment goes down.
An analysis from the Center’s news division, the Ocean State Current, found that the number of people living in the counties right over the border in Connecticut and Massachusetts who are employed increased by almost 11,000 from May 2011 to May 2012, more than twice RI’s new jobs.
| Summary Table | ||
| Percentage | National Rank | |
| Chart 1, U-3 unemployment, July 2012 | ||
|
10.7 | 48 |
|
12.0 | 50 |
|
10.8 | 49 |
| Chart 2, U-1 unemployment 15+ weeks, 2Q12 | ||
|
6.7 | 48 |
|
7.9 | 50 |
|
7.0 | 49 |
| Chart 3, U-5 unemployment incl. marginally attached, 2Q12 | ||
|
13.0 | 49 |
|
14.9 | 50 |
|
12.7 | 48 |
| Chart 4, U-6 unemployment incl. marginally attached and involuntary part time, 2Q12 | ||
|
20.3 | 49 |
|
22.1 | 50 |
|
18.9 | 48 |
| Chart 5, unemployment with January 2007 labor force, July 2012 | ||
|
10.7 | 48 |
|
16.4 | 50 |
|
14.2 | 49 |
| Chart 5, unemployment with February 2010 labor force, July 2012 | ||
|
11.8 | 48 |
|
12.9 | 49 |
|
13.4 | 50 |
| Chart 6, distance from prerecession employment peak, July 2012 | ||
|
-6.7 | 48 |
|
-10.5 | 50 |
|
-9.8 | 49 |
| Chart 7, employment growth since February 2010, July 2012 | ||
|
-1.1 | 49 |
|
-0.7 | 48 |
|
-1.7 | 50 |
Time to Take Responsibility
Overall, Rhode Island’s picture is what one would expect when the officials who control the overly burdensome threads of government place the status quo above progress. The state’s economy has been stagnant and drifting downwards, as Rhode Islanders for whom stagnation is not good enough make other plans.
The kid brother who never takes responsibility or initiative for himself will tend to trail behind, much as Gov. Chafee and Speaker Fox passively describe their state’s economy. That should not be accepted; too many Rhode Islanders are being harmed and finding their aspirations put on hold.
***
Media Release
FOR IMMEDIATE RELEASE: September 4, 2012
RI Uniquely Suffers Bleak Employment Outlook
Governor Chafee Should Consider Facts Before Speaking to National Audience from Charlotte
As Rhode Island Governor Chafee prepares to speak to a national audience from the DNC Convention one day after Labor Day, he should consider that his state suffers from the bleakest labor outlook of any state in the nation, according to a report issued today by the RI Center for Freedom & Prosperity. The state-based think tank also criticized the governor and other state leaders for their inaction and announced plans to release its own set of recommended policy reforms.
The report shows that Rhode Island is alone in ranking in the bottom two states in the nation with regard to its unemployment rate, its continuing workforce and employment degradation, and its overall employment loss since both the recession and the recovery. The state is unique in its poor standing across all of these important job measurement categories.
“As we have been saying for months, absolutely nothing is being done to improve our alarming jobs slump,” said Mike Stenhouse, CEO for the Center. “Why are we not having a special session of the General Assembly this fall?” he inquired.
“We’re traditionally first into a recession and last out,” Gov. Chafee told David Klepper of the Associated press, in December 2011.1 A few weeks later, RI House Speaker Gordon Fox, arguably the most powerful politician in the state, told WPRI’s Newsmaker interviewers the same thing, almost verbatim. This general attitude has translated into inaction in both the executive and the legislative branches. “It is not a viable economic plan to simply to wait for a national recovery to pull the state forward,” added Stenhouse.
Citing today’s report as irrefutable evidence of the need for immediate and bold reforms to provide Ocean State residents with renewed opportunities and long-term financial security for their families, the RI Center for Freedom & Prosperity also announced that it will offer its own solutions to address one of the biggest challenges in the state’s history.
“We have the second highest unemployment rate in the nation… and our General Assembly does nothing. We are one of only three states that has lost employment since February 2010… and this administration does nothing. We have the worst business climate in the nation… and our business and political leaders do nothing! Our jobs crisis has resulted in a decade-long loss of taxpayers to other states… and the political class does nothing,” continued Stenhouse. “The inaction of our do-nothing politicians has cost our state jobs because of their politics-as-usual approach. Our Center does not cave to special interests and we are not afraid to act. We will provide a positive vision for our state, along with a well-researched set of policy reforms to solve our dismal jobs problem.”
In filling part of the leadership void in the state, the Center plans to publish tomorrow its Prosperity Agenda for Rhode Island, which will recommend a dozen significant policy reforms. “Hopefully, our Center’s employment report today and our suggested policy reforms tomorrow will spur the debate that Rhode Island must have now! We encourage voters and candidates to reject the political class’s approach of doing nothing and, instead, to raise awareness of this vital problem and openly discuss all legitimate solutions during the upcoming campaign season,” concluded Stenhouse.
The Rhode Island Center for Freedom and Prosperity, a non-partisan public policy think tank, is the state’s leading free-enterprise advocacy organization. With a credo that freedom is indispensable to citizens’ well-being and prosperity, the Center’s mission is to stimulate a rigorous exchange of ideas with the goal of restoring competitiveness to Rhode Island through the advancement of market-based reform solutions.

Leave a Reply
Want to join the discussion?Feel free to contribute!